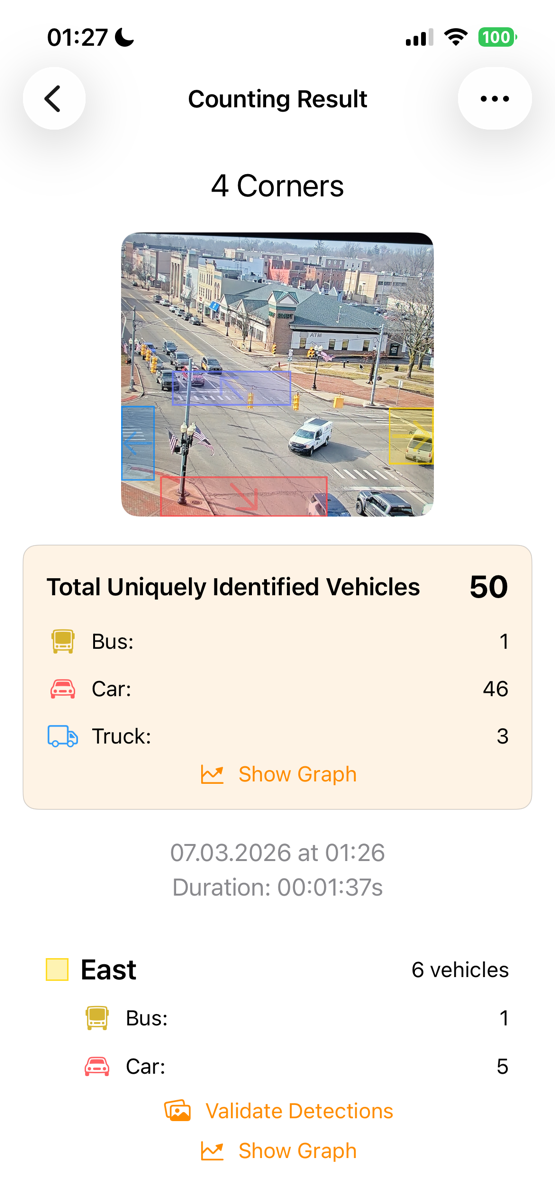
After your session, you'll see the **Tracking Results** screen. At the top, you’ll find the session name, along with an image that displays the placement of your detection boxes.
The **Total Unique Vehicles Tracked** indicates the number of distinct vehicles counted across all boxes. If a vehicle passes through multiple boxes, it is counted only once in this total.
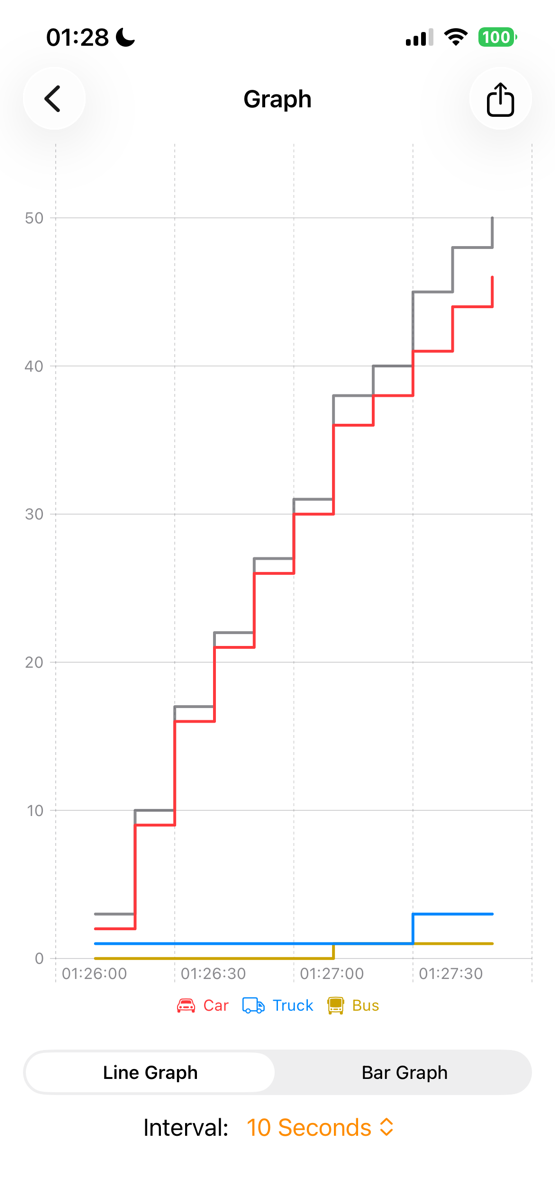
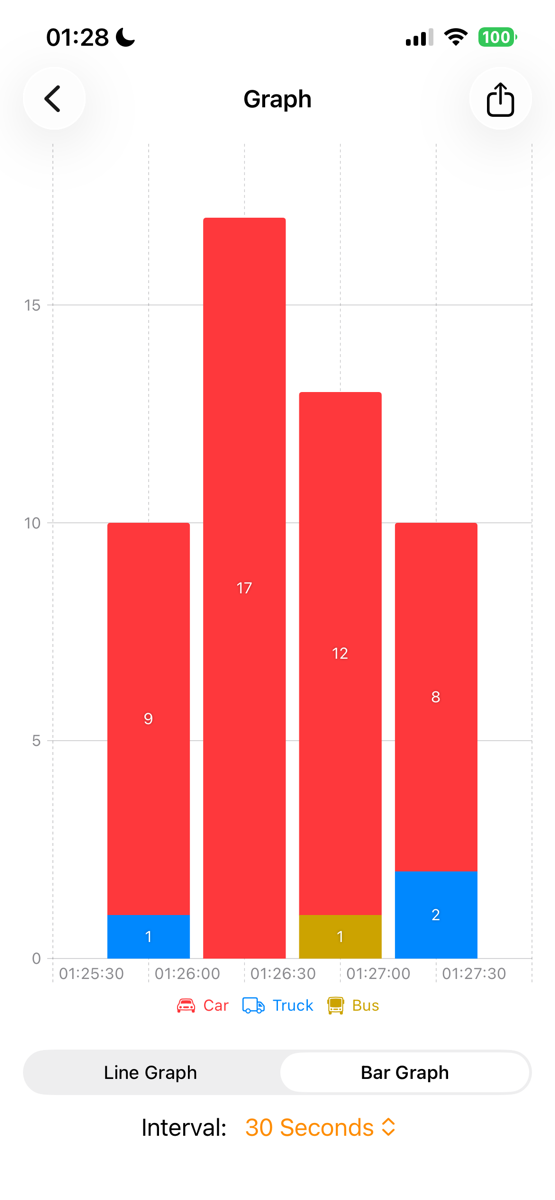
Click on **Show Graph** to view a timeline or bar chart that illustrates the counts for each vehicle type and for people.
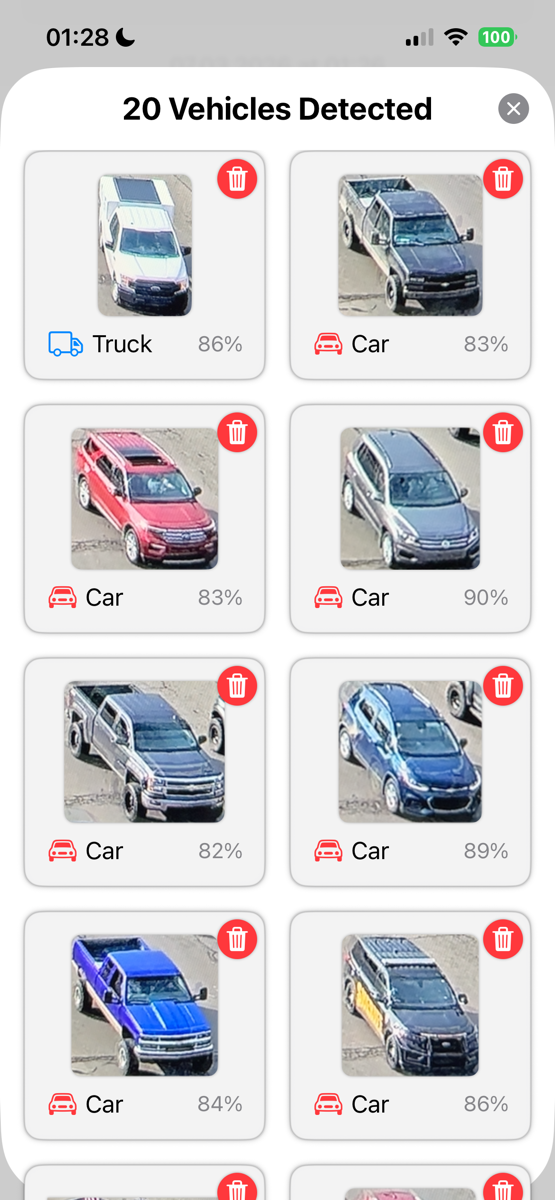
Next, you’ll see the session’s start date and duration, followed by detailed results for each detection box. If you enabled the “Save Object Images” option in the app settings, you can verify the counted objects with corresponding images. You can also remove incorrectly counted items by tapping the trash icon.
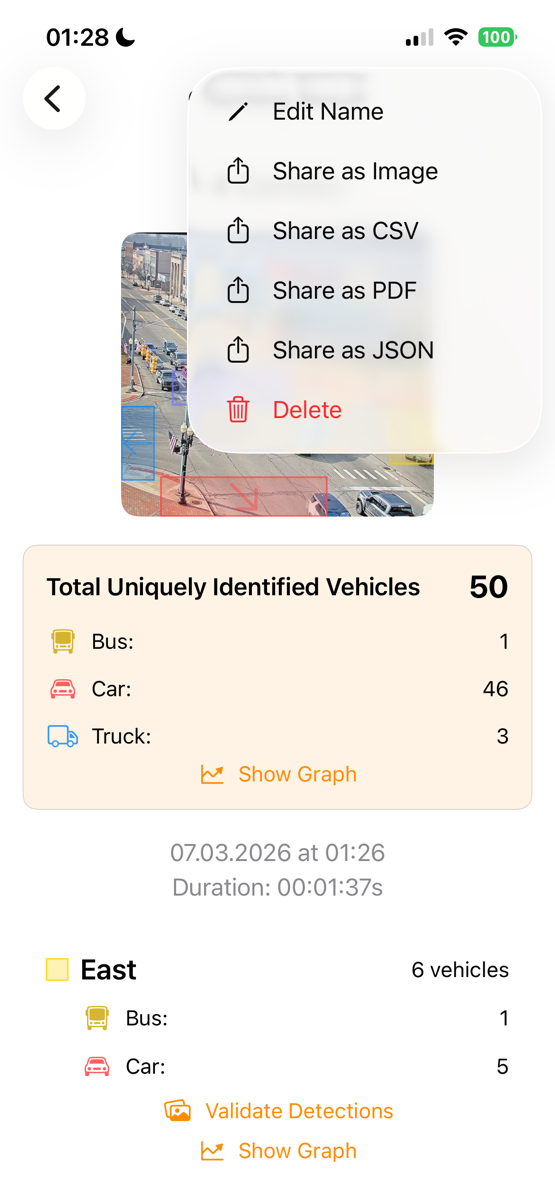
To edit, delete, or share your results as an image, CSV, PDF, or JSON, use the three-dot menu located in the top right corner.